ista UK
MinuteView
ista UK brought us in to work on MinuteView, their real-time energy management platform. The product had clear ambition and a lot of room to grow.
Together we grew it into one of ista's key commercial products, adopted group-wide by ista SE and rolled out across markets throughout Europe.
At a glance
Monitoring & Visibility
- Portfolio view from organisation level down to individual meter
- Half-hourly consumption across 14 utility types including heat, electricity, gas, water, hot water, cooling, EV charging and solar
- Key metrics including consumption, cost and carbon, tracked at every level
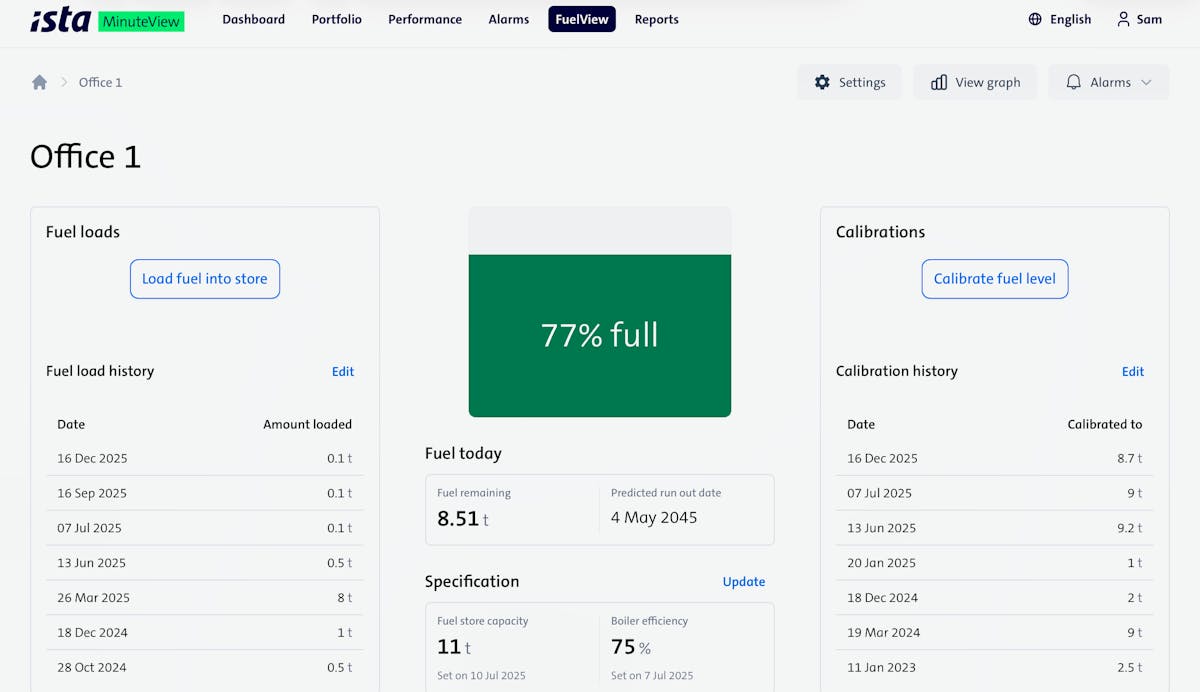
- FuelView: current level, consumption and days-until-empty forecast
- Big Screen mode for always-on communal displays
- Custom dashboards configurable at market or customer level
- Configurable alarms on any metric with custom schedules and recipients
Analysis & Benchmarking
- Energy graph with period comparisons and 3-year average baseline
- Consumption target tracking
- Operational hours and closed-period analysis
- Performance reports including generation vs import, supply vs consumption, efficiency and savings
- Weather-normalised (degree day) consumption analysis
- Graph overlays including max demand, reactive energy, Delta T and more
Reporting & Exports
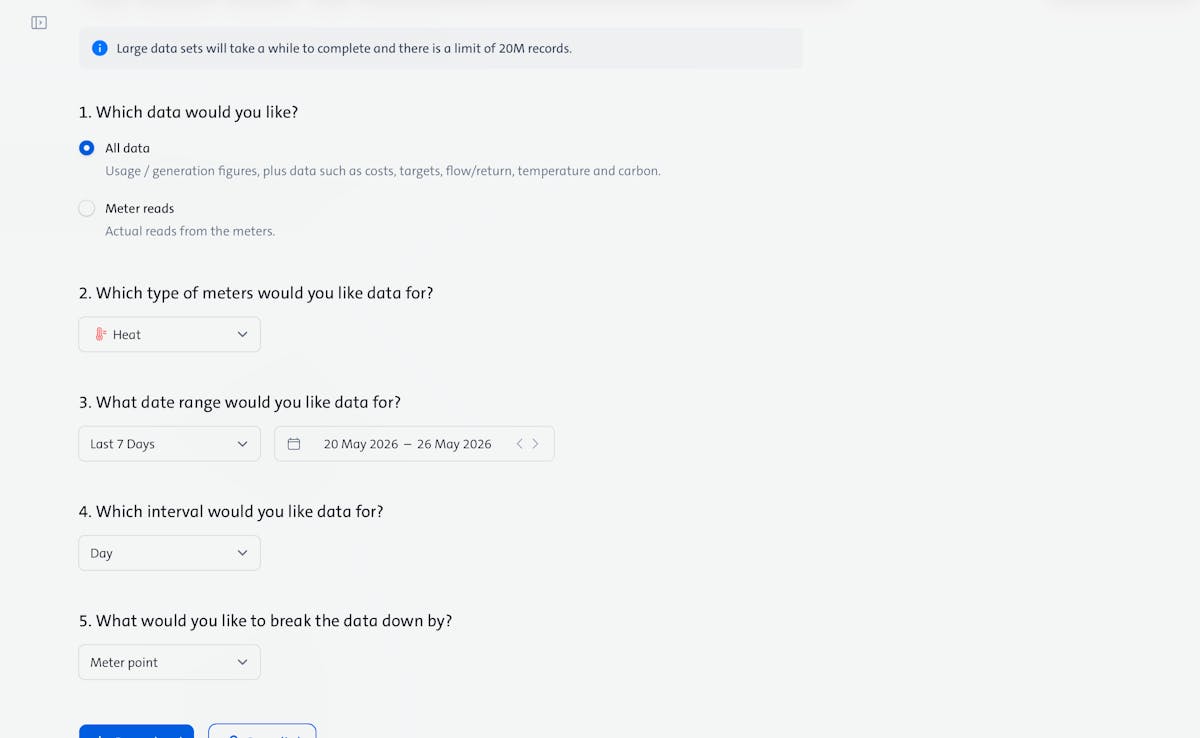
- Half-hourly consumption reports
- Meter read reports
- Full portfolio data export
- REST API for third-party integration
Multi-market
- 9 languages, 5 currencies, per-user unit of measure normalisation
- Enedis integration for automatic French meter data ingestion
- EnerPilot performance reports for the Spanish market
Our approach
MinuteView had genuine product ambition and ista had a clear view of where they wanted to take it. The platform had been built without a framework, which meant a lot of custom-built infrastructure, duplicated patterns and bespoke conventions that had grown harder to maintain and build on. To move forward properly, it needed investment in its foundations alongside the feature work.
Rather than a full replacement, we earned trust through delivery first, then moved into focused phases that delivered new features alongside the improvements underneath. Nothing was removed until its replacement was already running in production.
The platform we rebuilt on gave us what was missing: a proper testing framework, built-in security and an internationalisation system. We set up a workflow through PO Editor that puts translation management in the hands of each market's local team, so new markets can be onboarded without a significant engineering effort. MinuteView now runs across 20+ countries in nine languages and five currencies, with per-user unit of measure settings so each market sees data in the format they're used to.
The product
MinuteView is modular by design. Every account includes the portfolio view and energy graph. Performance reports, alarms, FuelView, Big Screen and custom dashboards are enabled where the account supports them, so each customer gets a view shaped around what actually matters to them.
Portfolio
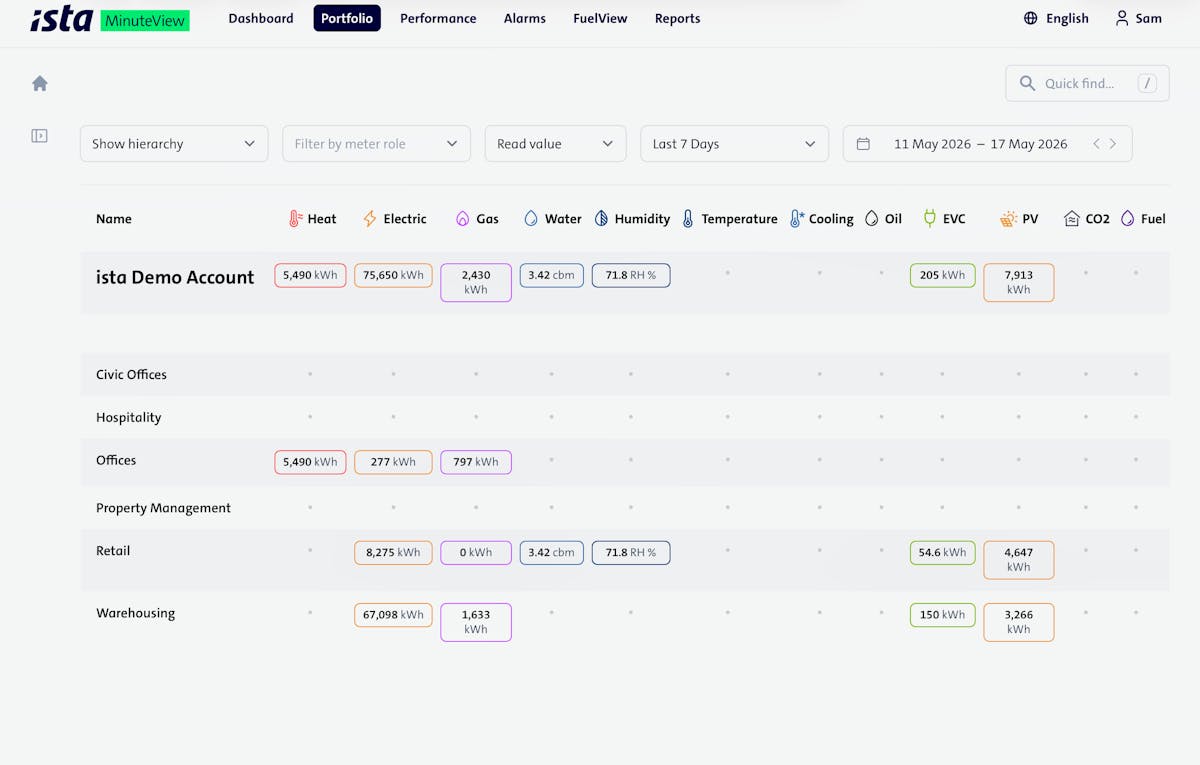
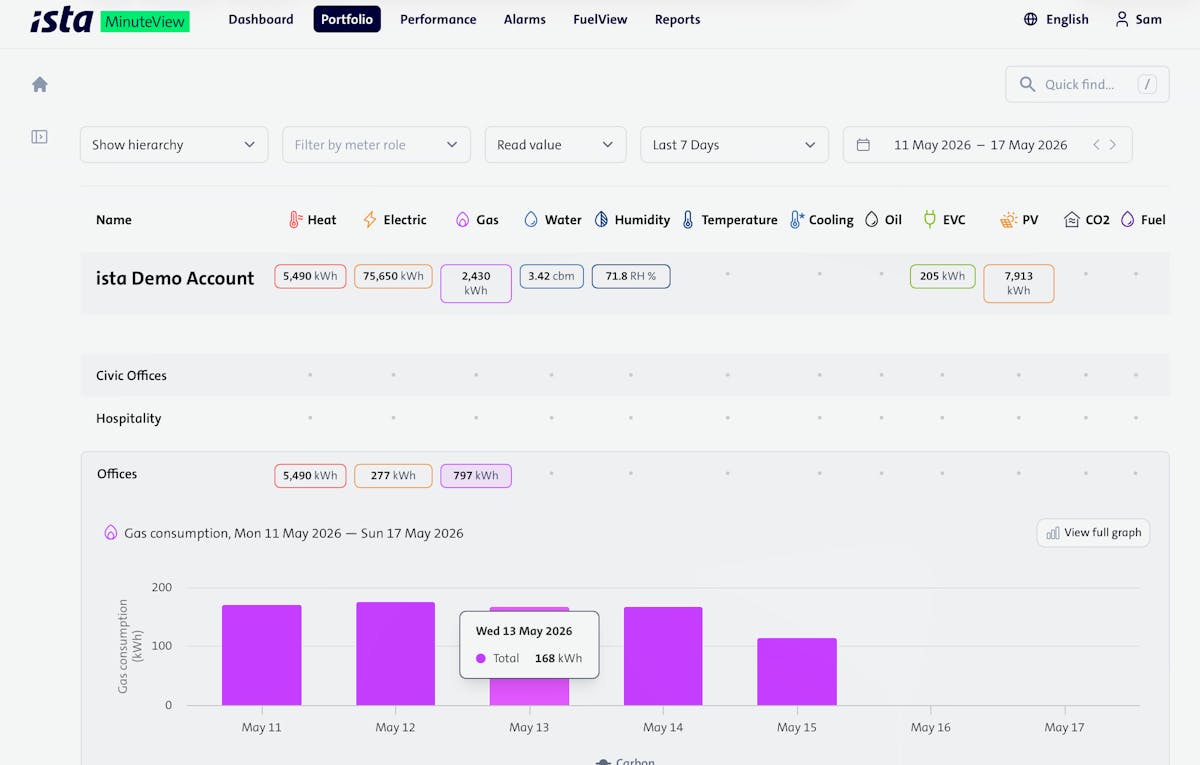
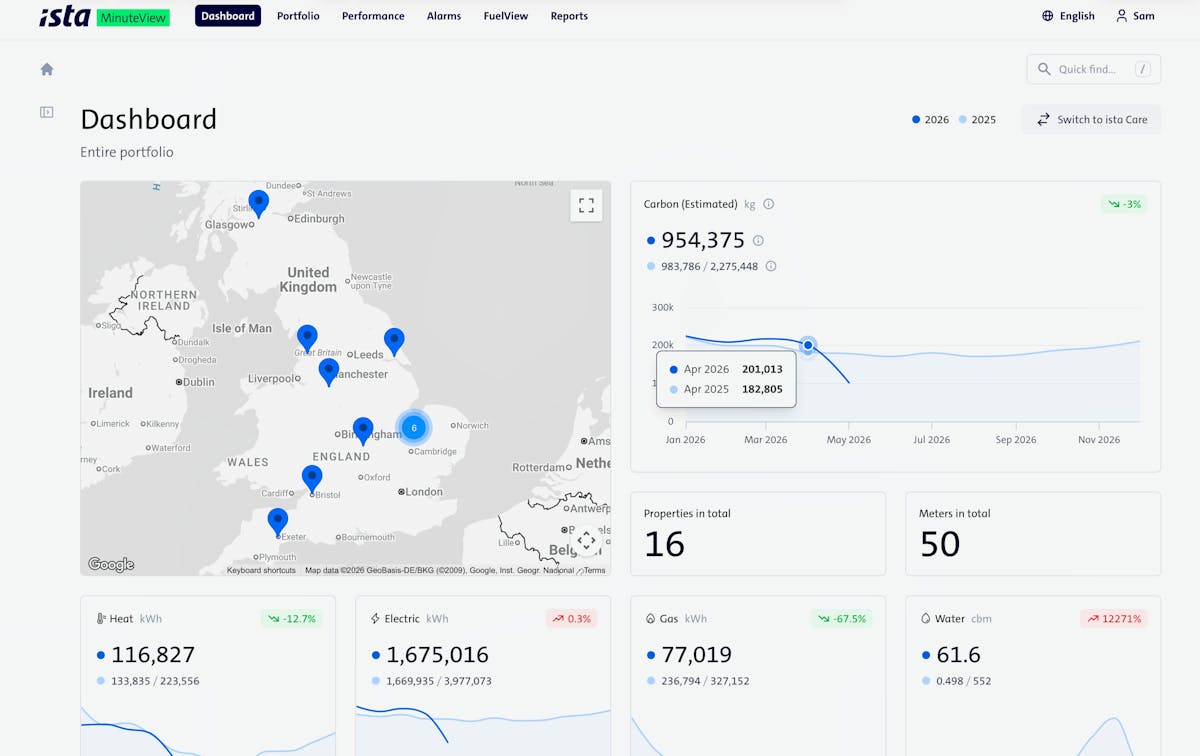
The portfolio view mirrors a customer's own business structure, from the top of their organisation down to individual meter, giving every level of the business live visibility into what it's using, what it's spending and what it's emitting. It covers 14 utility types including heat, electricity, gas, water, hot water, cooling, EV charging and solar.
Energy graph
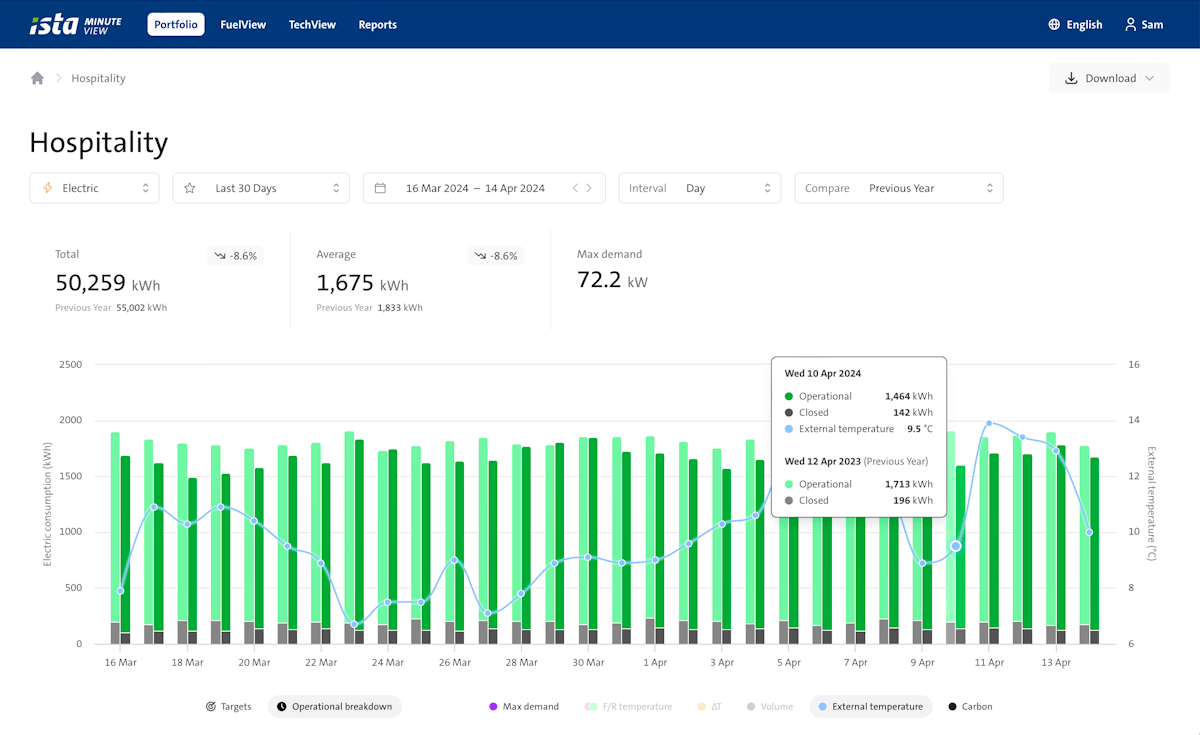
The energy graph spans every interval from half-hourly to yearly. Any period can be compared against the same time last week, month or year, or against a 3-year average baseline. Consumption targets can be set and tracked directly in the graph, alongside overlays for temperature, operational hours, carbon, max demand, reactive energy and more. The operational hours overlay makes closed-period analysis straightforward: what a building consumes outside of operating hours is often where the most actionable savings are.
Performance reports
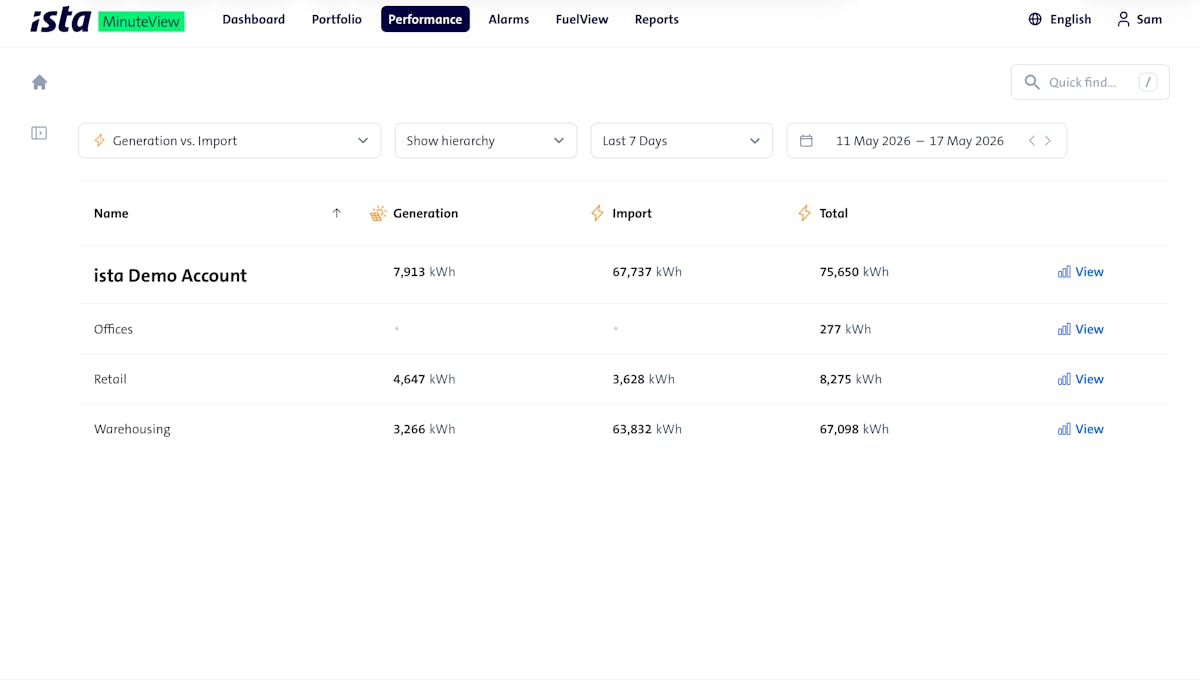
Performance reports give a structured view across the portfolio: generation versus import, supply versus consumption, efficiency and savings. Where the graph and portfolio view show what's happening over time, performance reports cut across the data to surface the numbers that matter for planning and reporting.
Alarms
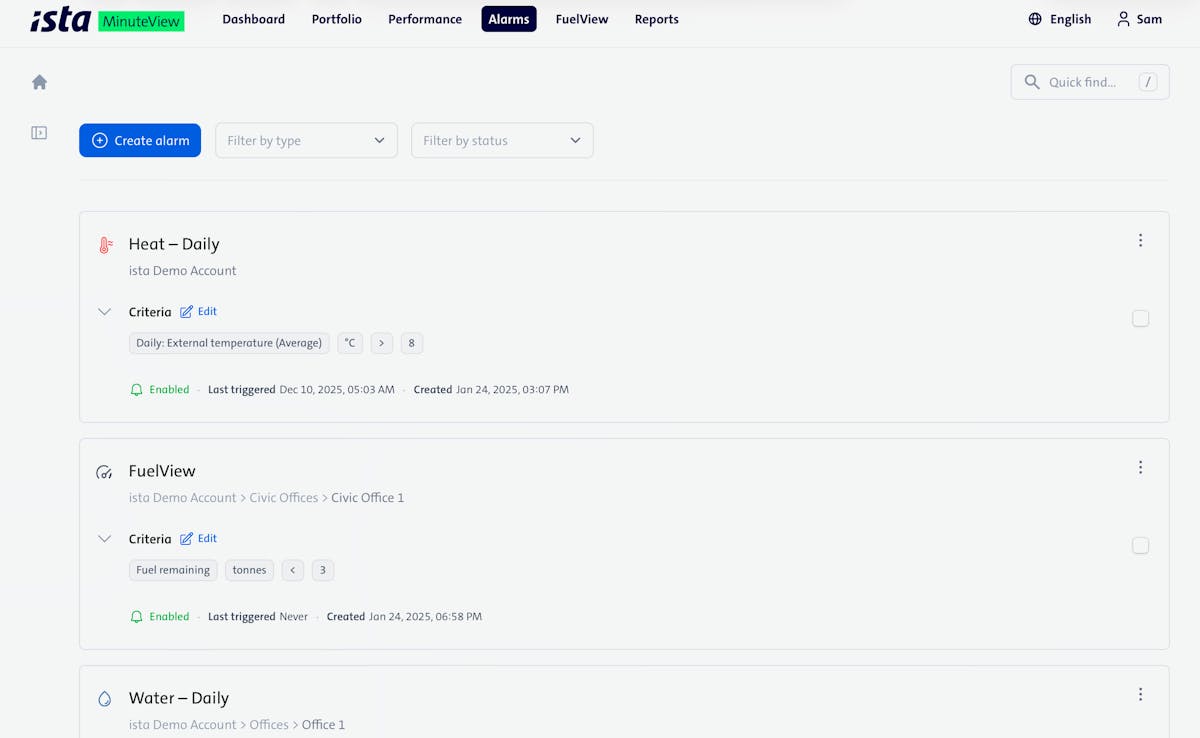
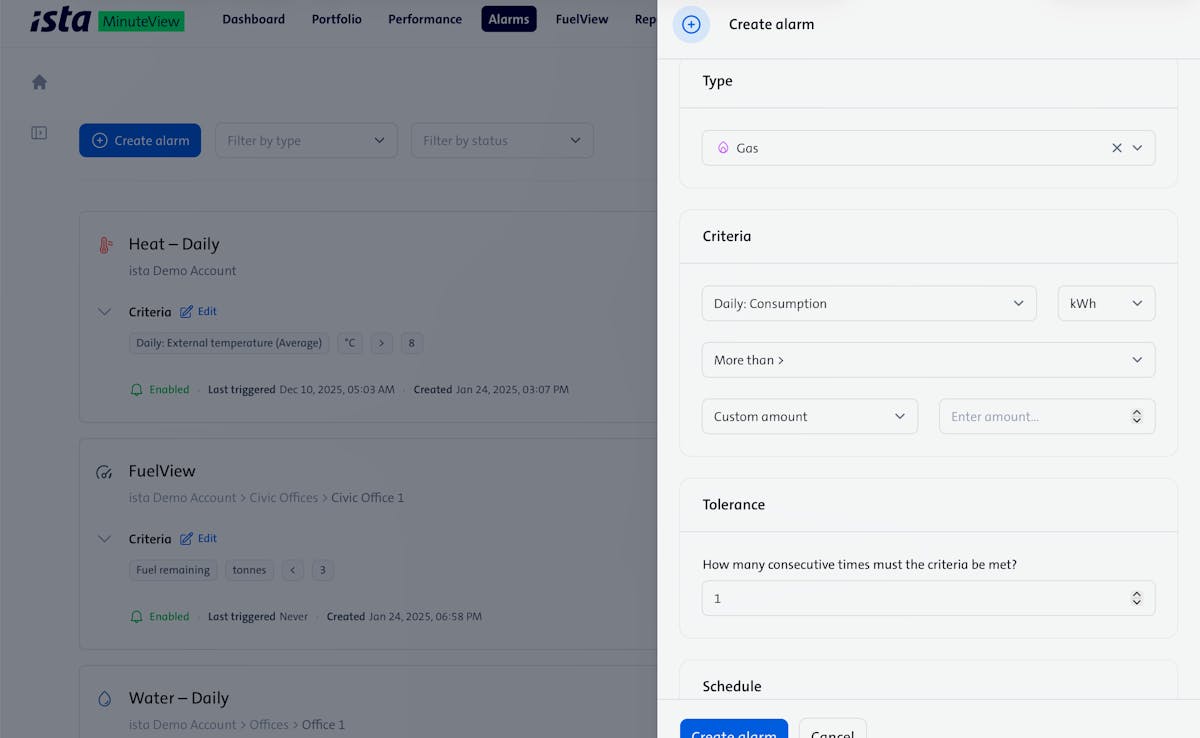
Alarms can be set on any metric, including consumption, cost, carbon, Delta T and zero reads, and are designed to surface things that genuinely matter. They're fully configurable: set them to fire immediately, or tune them to only trigger after a pattern has repeated to cut out noise from momentary blips. Custom schedules, up to ten recipients per alarm and a full activity timeline mean the right people are always in the loop.
Big Screen
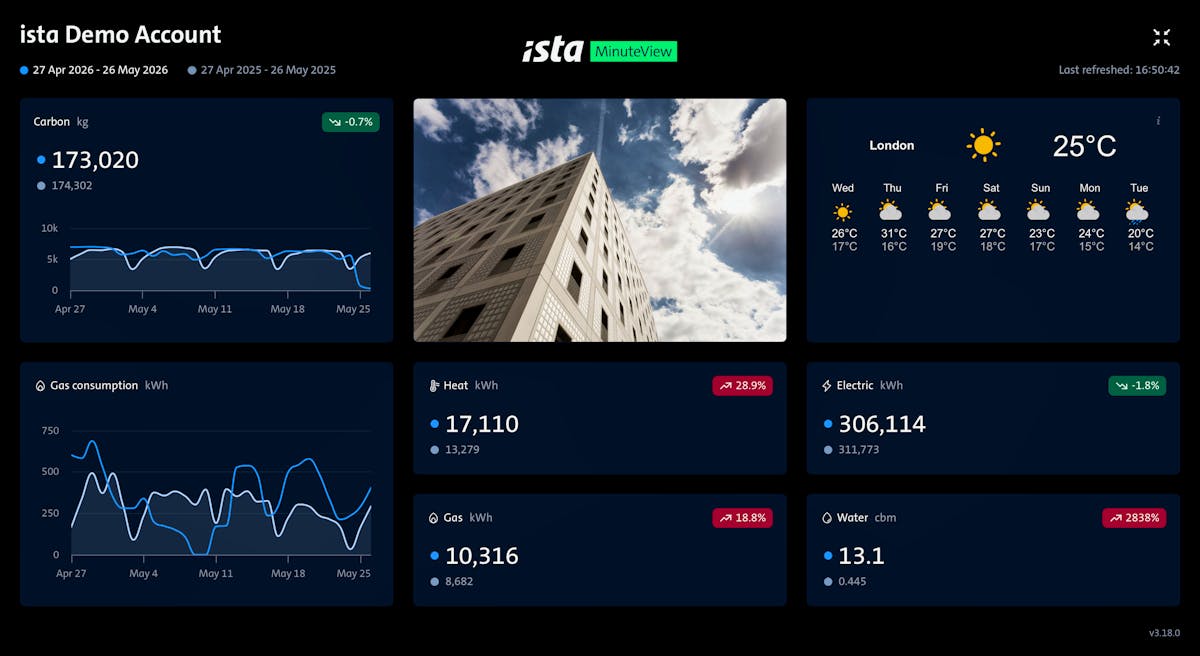
Designed for wall-mounted displays in communal spaces like staff rooms, reception areas and open-plan offices, Big Screen shows energy figures at a scale built for distance viewing, with larger type, higher contrast and utilities shown automatically based on the site account.
ista use it in their own offices as part of their sustainability programme. The aim is to make energy consumption visible to the people in the building, not just the facilities team.
Custom dashboards
Dashboards can be configured at market or customer level, giving each account a default view built around the metrics and priorities that matter most to that specific business or region.
FuelView
Rather than sensor hardware that needs ongoing maintenance, FuelView calculates consumption from calorific values, tank capacity and boiler efficiency, showing the current level and a days-until-empty countdown. Facilities teams get reliable fuel forecasting without the hardware headaches.
Reports and exports
MinuteView generates half-hourly consumption reports and meter read reports, with full portfolio data exports covering all key metrics. A REST API supports integration with third-party systems, so MinuteView data can feed directly into existing reporting pipelines or business intelligence tools.
Going global
What started as a UK product grew into a platform adopted group-wide by ista SE and rolled out across markets throughout Europe. It got there incrementally as each new market joined.
Denmark
A large district heating customer in Denmark prompted some of the most specialist work on the platform. Delta T monitoring tracks the temperature differential in heating networks: when it falls, energy is circulating without being absorbed, which is a direct and often invisible loss. Weather-normalised (degree day) consumption analysis is calibrated to local conditions, and performance reports cover heat pump efficiency, gas boiler efficiency and hot water production.
Spain
The Spanish market introduced EnerPilot performance reports, giving ista's customers structured savings analysis tied to their commercial energy-saving product.
France
France required an integration with Enedis, the national grid operator, to automatically pull in meter data for French customers. This removed a manual data entry process and made the French deployment significantly simpler to manage.
Infrastructure
As MinuteView became a group-wide product, it needed to operate as one. We migrated it onto ista's internal enterprise infrastructure, aligning it with the rest of the group's technical estate. We used AI tooling to help generate and validate the migration work, which made the process faster without cutting corners.
Security
Security in MinuteView is a product of how it was built, not something added to pass an audit. Building on a proper modern foundation meant protections were in place from day one rather than retrofitted. ista run regular independent security audits on the platform and MinuteView has consistently come through them well.
Fancy a chat?
Sometimes it’s just useful to talk things through with someone who’s seen similar situations before.
No pitch, just a conversation. We’ll talk things through and see where we can help.